QLLM For Airlines

TensorQ Air Powering New Generation RM For Airlines

  • Demand Forecasting Is Underestimating Demand – Not Quantified
  • Dynamic Product / Pricing – Not Personalized
  • Local Optimal Revenue – Not Quantified
  • Every Function Has Own Model For Generating Demand / Revenue
  • Revenue Effectiveness Is Unknown – Not Quantified
  • AI Agents Are Not Accurate …

With These Gaps Its Demonstrable That about 10-15% of Revenue is Left on the Table. Uncollected

Main Themes of TensorQ Air

  • Dramatic Improvement in Revenue Management, addressing these gaps
  • Autonomous Agentic AI For Airline Commercial
What is TensorQ Air

What is TensorQ Air ?

Revenue Finder AI
Metric Mover AI

Fully Layered Commercial Engine

Based on a Foundation Model for Quant – QLLM

Forecasts AND Optimizes True Demand

Potentially drives 100% Effectiveness

Provides APIs To Connect To Any App / System or Data Repo

TensorQ Stack Architecture

TensorQ Stack Architecture

C-Suite
Strategic Analytics
Commercial Alignment for Enterprise RM
NDC
Dynamic Pricing
Network
Linear Optimization
Microsegment
Numerical Optimization
Network
Dynamic Optimization
Microsegment Demand Forecast Model
Demand Enrichment, ETL
Streaming Data
Batch Data
Data Model of Microsegments
HR, IT, Finance,
Cargo, Ops
Transactional Data
Orders, PNRs, Schedules, Promotions,
Loyalty, Distribution, Marketing
External Data – Pricing, Commissions,
Schedules, Events, GDP, Weather

Use APIs to link up any app to the Microsegment data model

Execute Local Optimization for each Microsegment in parallel. Network is globally optimized due to elegant MS design

Create Multi Variable Demand Model For Each Microsegment

Vectorize Inputs, Outputs in Microsegments

Create 1 training and 1 scoring pipeline

Automatically create Microsegment Model

Data imported from Source. No ETL Needed

Core RM / NP Strategic IT / AI Functions

Why Today’s RM Cannot Find Revenues, And Avoid Losses ?

Virtually all RM systems work on the past-predicts-future Time Series theory. But past sales alone do not predict future sales.

This theory fell apart a long time ago, and Covid made it obsolete.

Why Today’s RM Cannot Find Revenues, And Avoid Losses ?

Only TensorQ uses a combination of:

Microsegments +

Bayesian regression +

Monte Carlo method.

There are numerous inputs, from past sales to social media signals, to virus spread data to news announcements to discounts to weather patterns…

This delivers predictions that fit actual outcomes better.

Microsegment Revenue Opportunity Heat Map

TensorQ’s Equations Microsegments Price Incentives Events Branding Loyalty Rewards # Agencies # Salesforce Trainings I₁ I₂ I₃ I₄ Iₙ Drivers C11 C12 C13 … C1n C21 C22 C23 … C2n C31 C32 C33 … C3n C41 C42 C43 … C4n Cm1 Cm2 Cm3 … Cmn Tensor = O₁ O₂ O₃ O₄ Oₘ Demand Yield Revenue Customer Satisfactio
Siloed vs TensorQ Integrated Modeling

Example of Siloed vs TensorQ’s Integrated Modeling

Today Siloed Model Siloed Data Siloed Output
RM System RM Modeling Historical Bookings, Price Bookings as a function of Price
Sales Force Sales Modeling Agency Sales, Incentives Sales as a function of Incentives
NP System NP Modeling Revenues, Schedule Revenue as a function of Capacity, Slot
Excel Marketing Modeling Responses, Offers Response as a function of Offers
Future Unified Model Unified Data Unified Output
TensorQ Full Commercial Modeling Historical Bookings, Price,
Agency Sales, Incentives,
Revenues, Schedule,
Responses, Offers
  • Bookings as a function of Price, Incentives, Schedule, Offers
  • Sales as a function of Price, Incentives, Schedule, Offers
  • Revenue as a function of Price, Incentives, Schedule, Offers
  • Response as a function of Price, Incentives, Schedule, Offers
Siloed vs TensorQ Integrated Modeling

Example of Siloed vs TensorQ’s Integrated Modeling

Today Siloed Model Siloed Data Siloed Output
RM System RM Modeling Historical Bookings, Price Bookings as a function of Price
Sales Force Sales Modeling Agency Sales, Incentives Sales as a function of Incentives
NP System NP Modeling Revenues, Schedule Revenue as a function of Capacity, Slot
Excel Marketing Modeling Responses, Offers Response as a function of Offers
Future Unified Model Unified Data Unified Output
TensorQ Full Commercial Modeling Historical Bookings, Price,
Agency Sales, Incentives,
Revenues, Schedule,
Responses, Offers
• Bookings as a function of Price, Incentives, Schedule, Offers
• Sales as a function of Price, Incentives, Schedule, Offers
• Revenue as a function of Price, Incentives, Schedule, Offers
• Response as a function of Price, Incentives, Schedule, Offers

Fully Autonomous Optimization Agent

  1. Agent is switched on
  2. Agent instructed to Optimize Metrics
  3. Itcontinuously optimizes the entire commercial function
  4. Pricing, Promotions, Marketing decisions autonomously taken
  5. Management informed of all the key levers optimized
How QLLM Supports Network Revenue Management

How QLLM Supports Network Revenue Management

Today’s Network RM

Network RM
  • Non-Linear Demand
  • High-Dimensionality (100s of Legs, 1000s of ODs)
  • Dynamic Pricing Next Big Challenge
  • LP and DP are difficult to solve

Full Network Effect and Linearization of Revenue, Demand Can Be Expressed with Independent Microsegments

MS1
MS2
MS3
MS100
MS1004
MS10005
Delivers Full Demand Forecasting
Supports Any Optimization Architecture
  • Leg RM Optimization
  • Network LP Optimization
  • Dynamic Programming
  • Numerical Optimization
Bid Prices For Dynamic Pricing
Option I : QLLM – Supports Dynamic Optimization

Option I : QLLM – Supports Dynamic Optimization

Max

i=1,j=1I,J pi max { f + v(x − 1), v(x) } + p0 v(x)

I – Itineraries
f – Itinerary Fare Class fare
x – demand allocated to Itinerary i on Leg j
J – Leg j

Max

i=1,j=1M,J pi max { f + v(x − 1), v(x) } + p0 v(x)

M – Microsegment Itineraries
f – Microsegment fare
x – demand allocated to Microsegment having Itinerary i on Leg j
J – Leg j
QLLM Microsegments   replace Fare Class Segmentation
Option 2 : QLLM Supports Network RM LP Optimization

Option 2 : QLLM Supports Network RM LP Optimization

Fare-class based LP

Max   ∑i=1,j=1I,J f y

S t
∑ yi ≤ cj

I – Itinerary Fare Class
f – Itinerary Fare Class fare
y – demand allocated to Itinerary i on Leg j
J – Leg j
Microsegments based LP

Max   ∑i=1,j=1M,J f y

S t
∑ yi ≤ cj

M – Microsegment Itinerary
f – Microsegment fare
y – demand allocated to Microsegment M
with itinerary i on Leg j
J – Leg j
QLLM Microsegments   replace Fare Class Segmentation
Option 3: QLLM’s Own Demand Optimization

Option 3: QLLM’s Own Demand Optimization

Maxi=1,j=1M,J   { f y − ( COS + COM + COT ) }

S t
∑yi ≤ cj

M – Microsegment Itinerary
J – Leg j
f – Microsegment fare
Y – demand allocated to itinerary i on Leg j
COS – Direct or Allocated Cost of Sale
COM – Direct or Allocated Cost of Marketing
COT – Direct or Allocated Cost of Technology

Forecasting in Microsegments
Demand = Linear function (company levers, domains, customer choice, Competitor Levers)

Optimization
Monte Carlo Numerical Optimization using Demand Model and Demand Drivers for Local Revenue Maximization of Microsegment

Local and Global Network Revenue Optimization
Primary effects of Demand is Local to microsegment
Demand Drivers including Fare optimized for each microsegment subject to Leg capacity constraints
Aggregating Local optimal demand and revenue results in Global optimal of demand and revenue
Supply optimization is implemented through Bid Price control

Microsegment Optimization Ensures Local and Network Wide Optimal
Benefits of using QLLM

Benefits of using QLLM

Revenue Optimization Becomes Futuristic, Fully Blending AI and OR
  • Very Accurate Leg-Segment AND Origin and Destination Forecasting
  • You can continue your leg forecasting, use QLLM’s Leg and OD Forecasting, making development unnecessary but test it out thoroughly.
  • QLLM forecasting also gives you the same total forecast revenue by any view : Sales, RM, NP, Distribution, Loyalty, Corporate vs Retail, GDS vs Online, etc
  • Provides an accurate and easy path to migrate RM towards NDC requirements, dynamic pricing
  • You can internally develop this LLM using our design. Total ownership and control based on license
  • Very economical in the long run and a positive step function change in Revenue
17
Economics of QLLM

Economics of QLLM

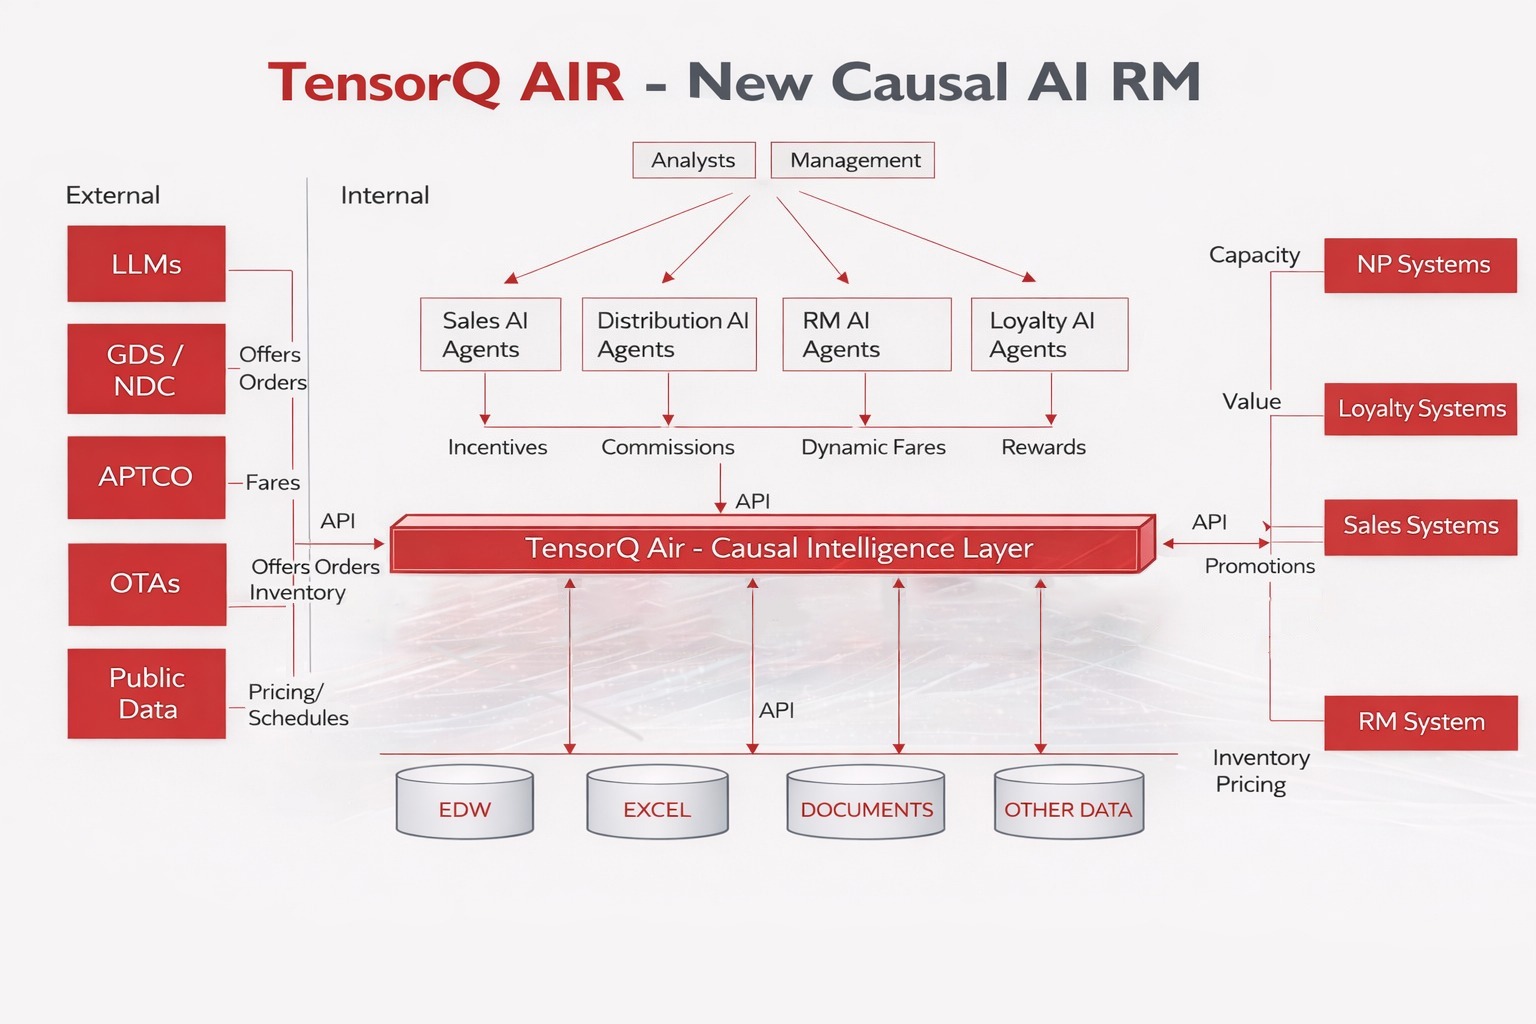
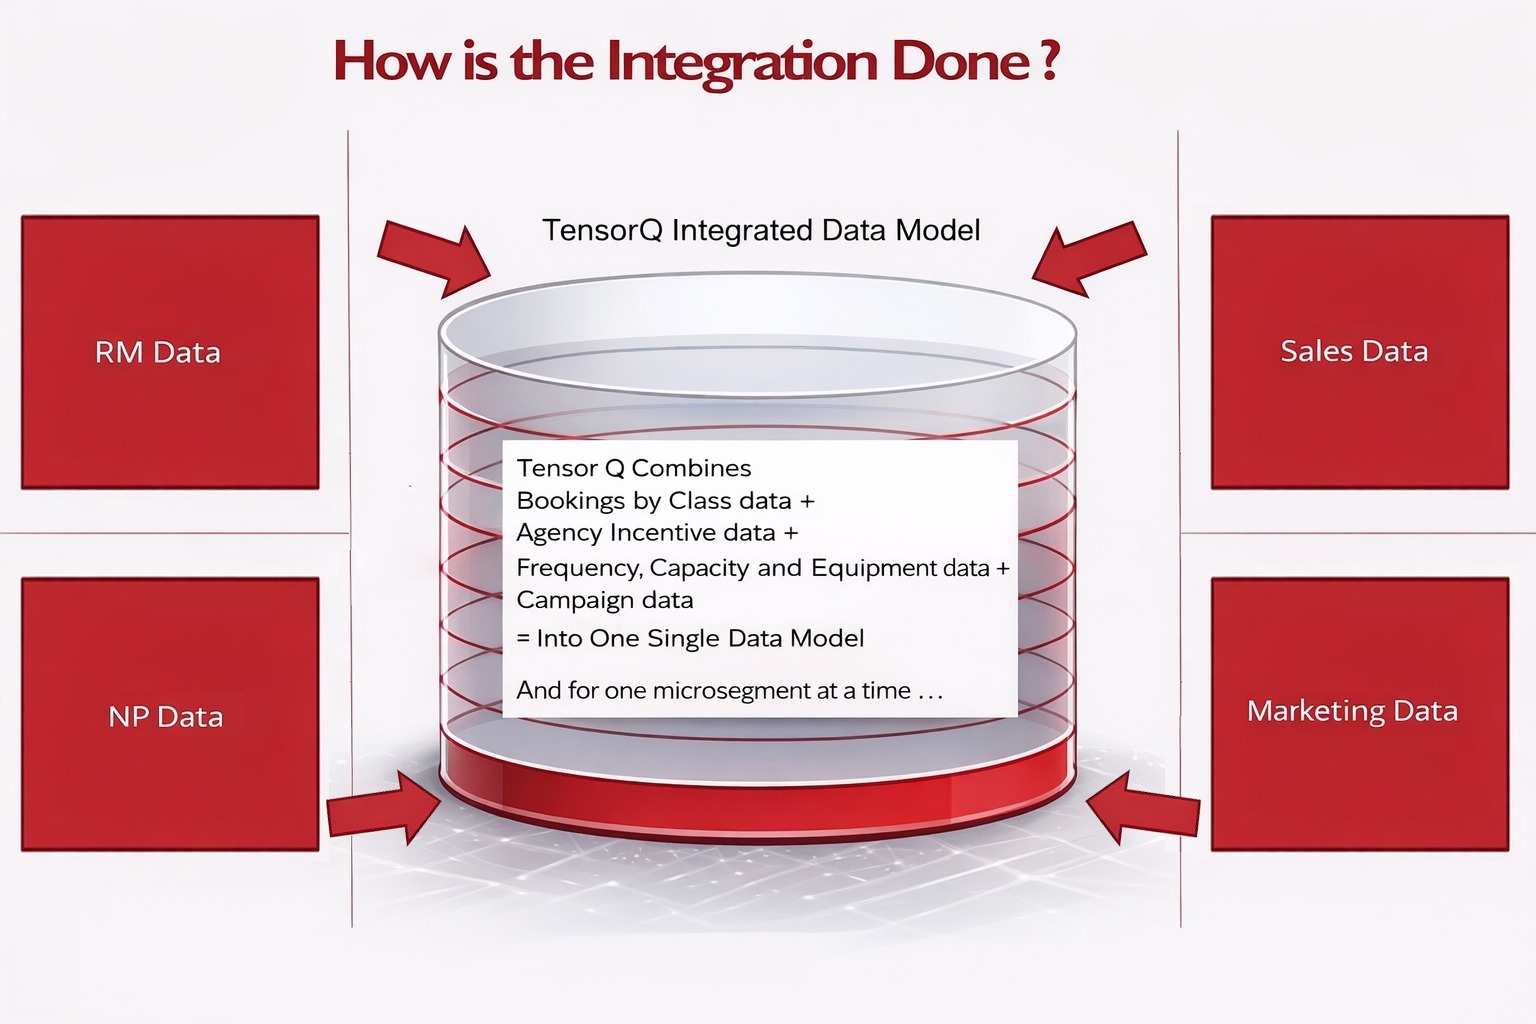
Your entire AI roadmap is solved in a single Model

Takes 6 months vs 5 years for normal AI roadmap

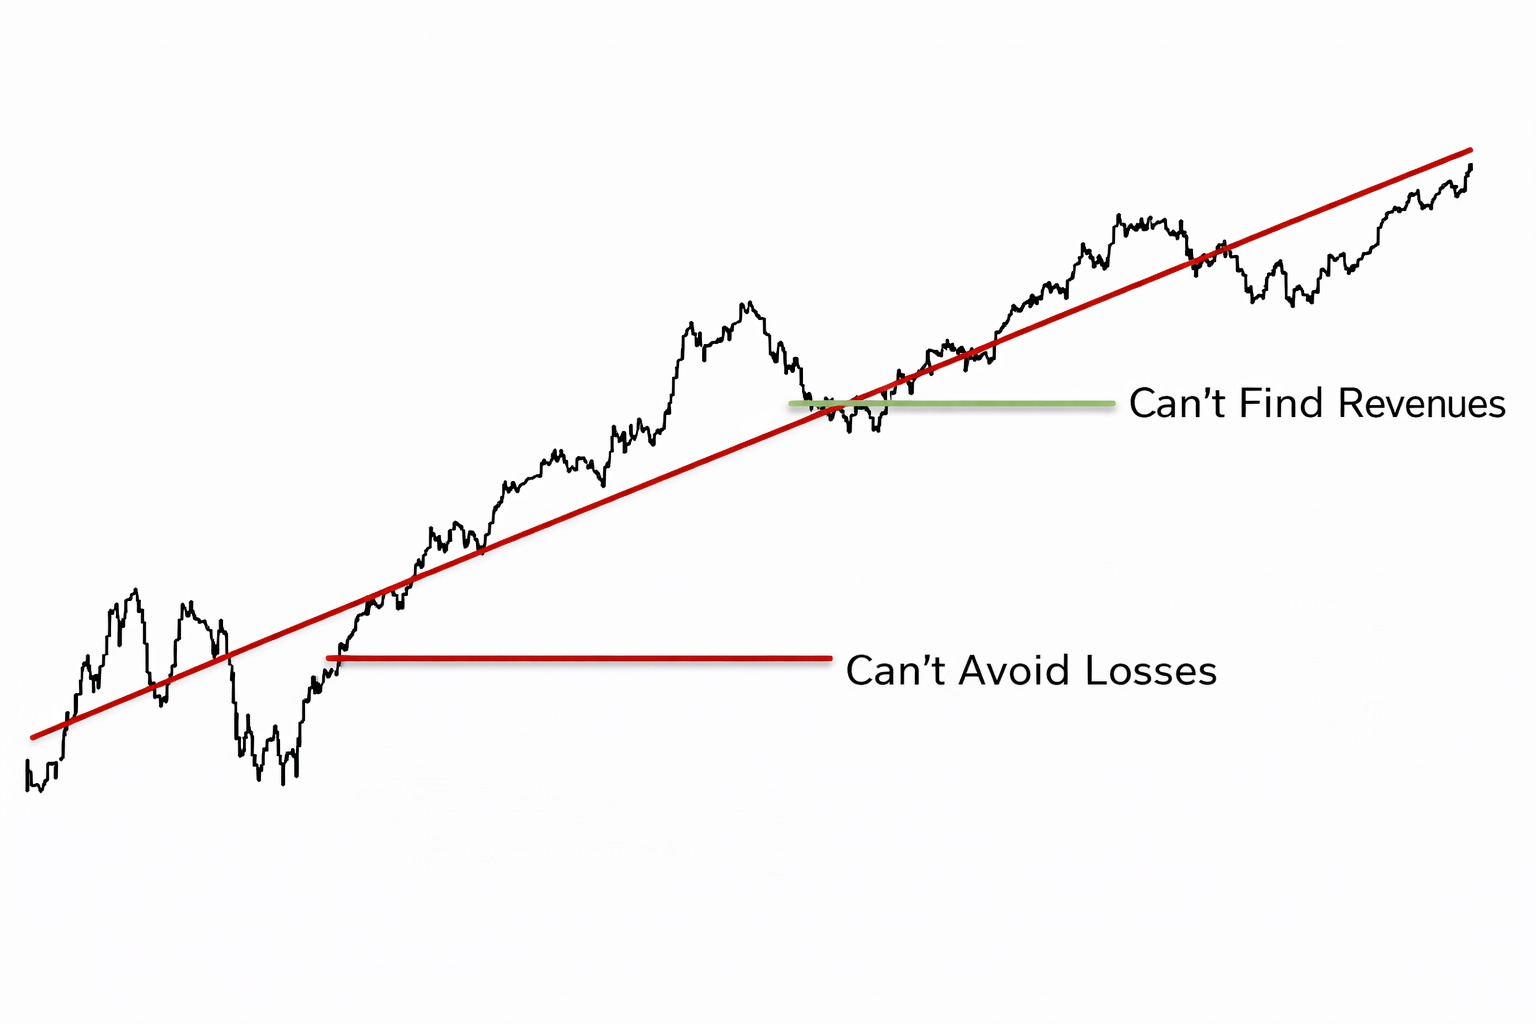
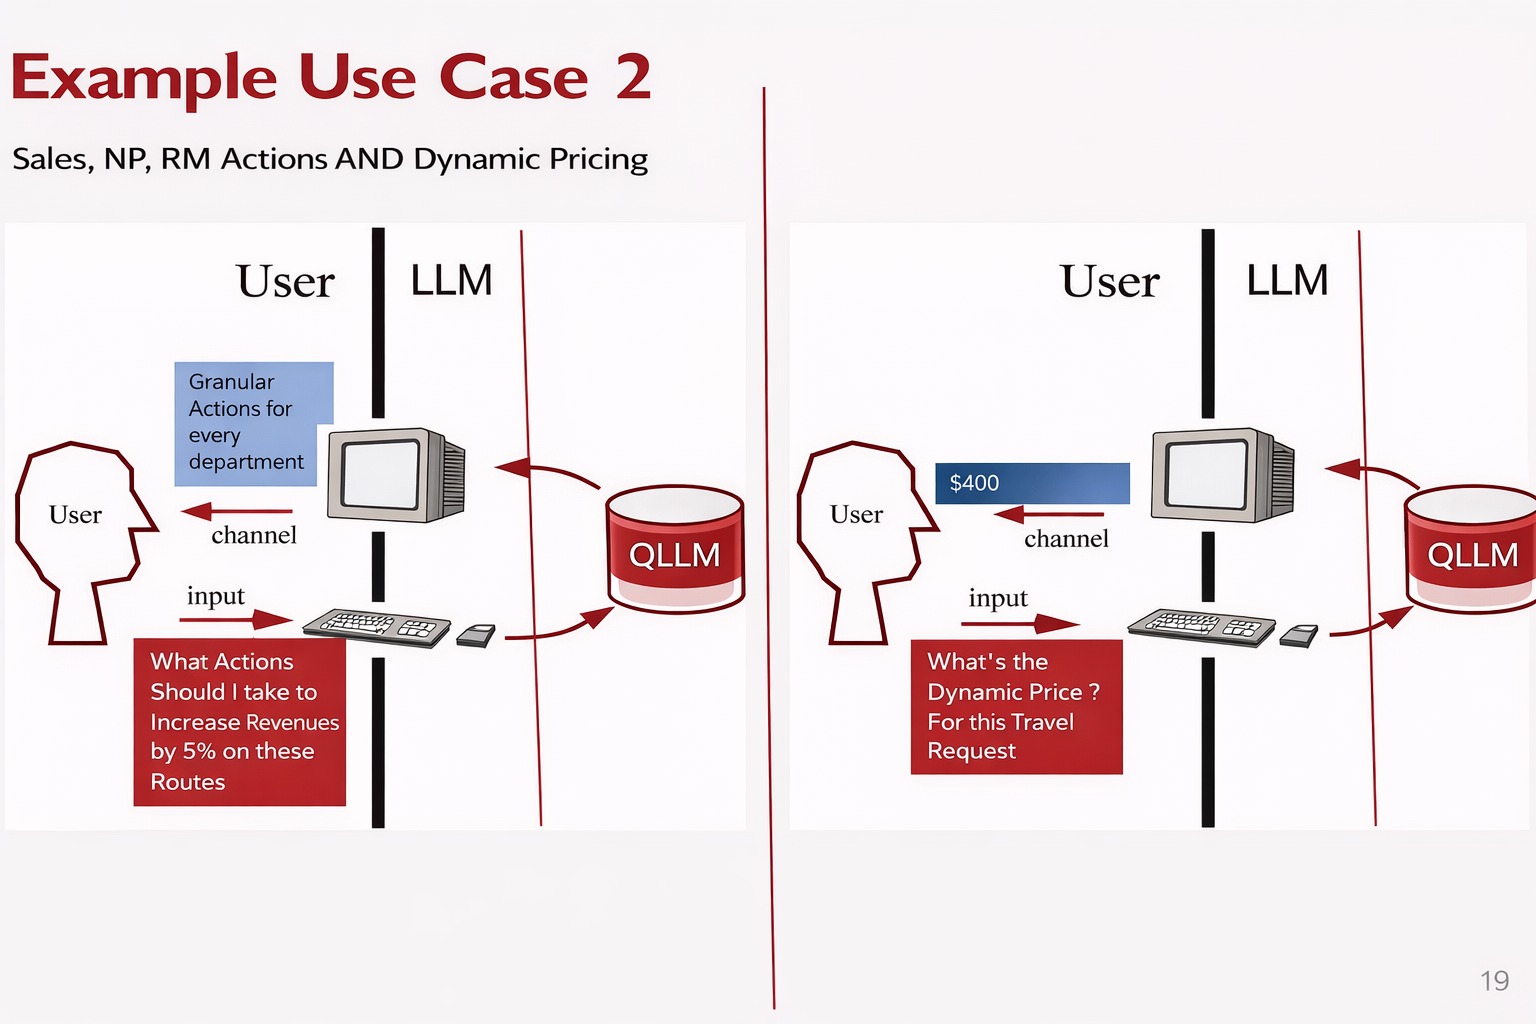
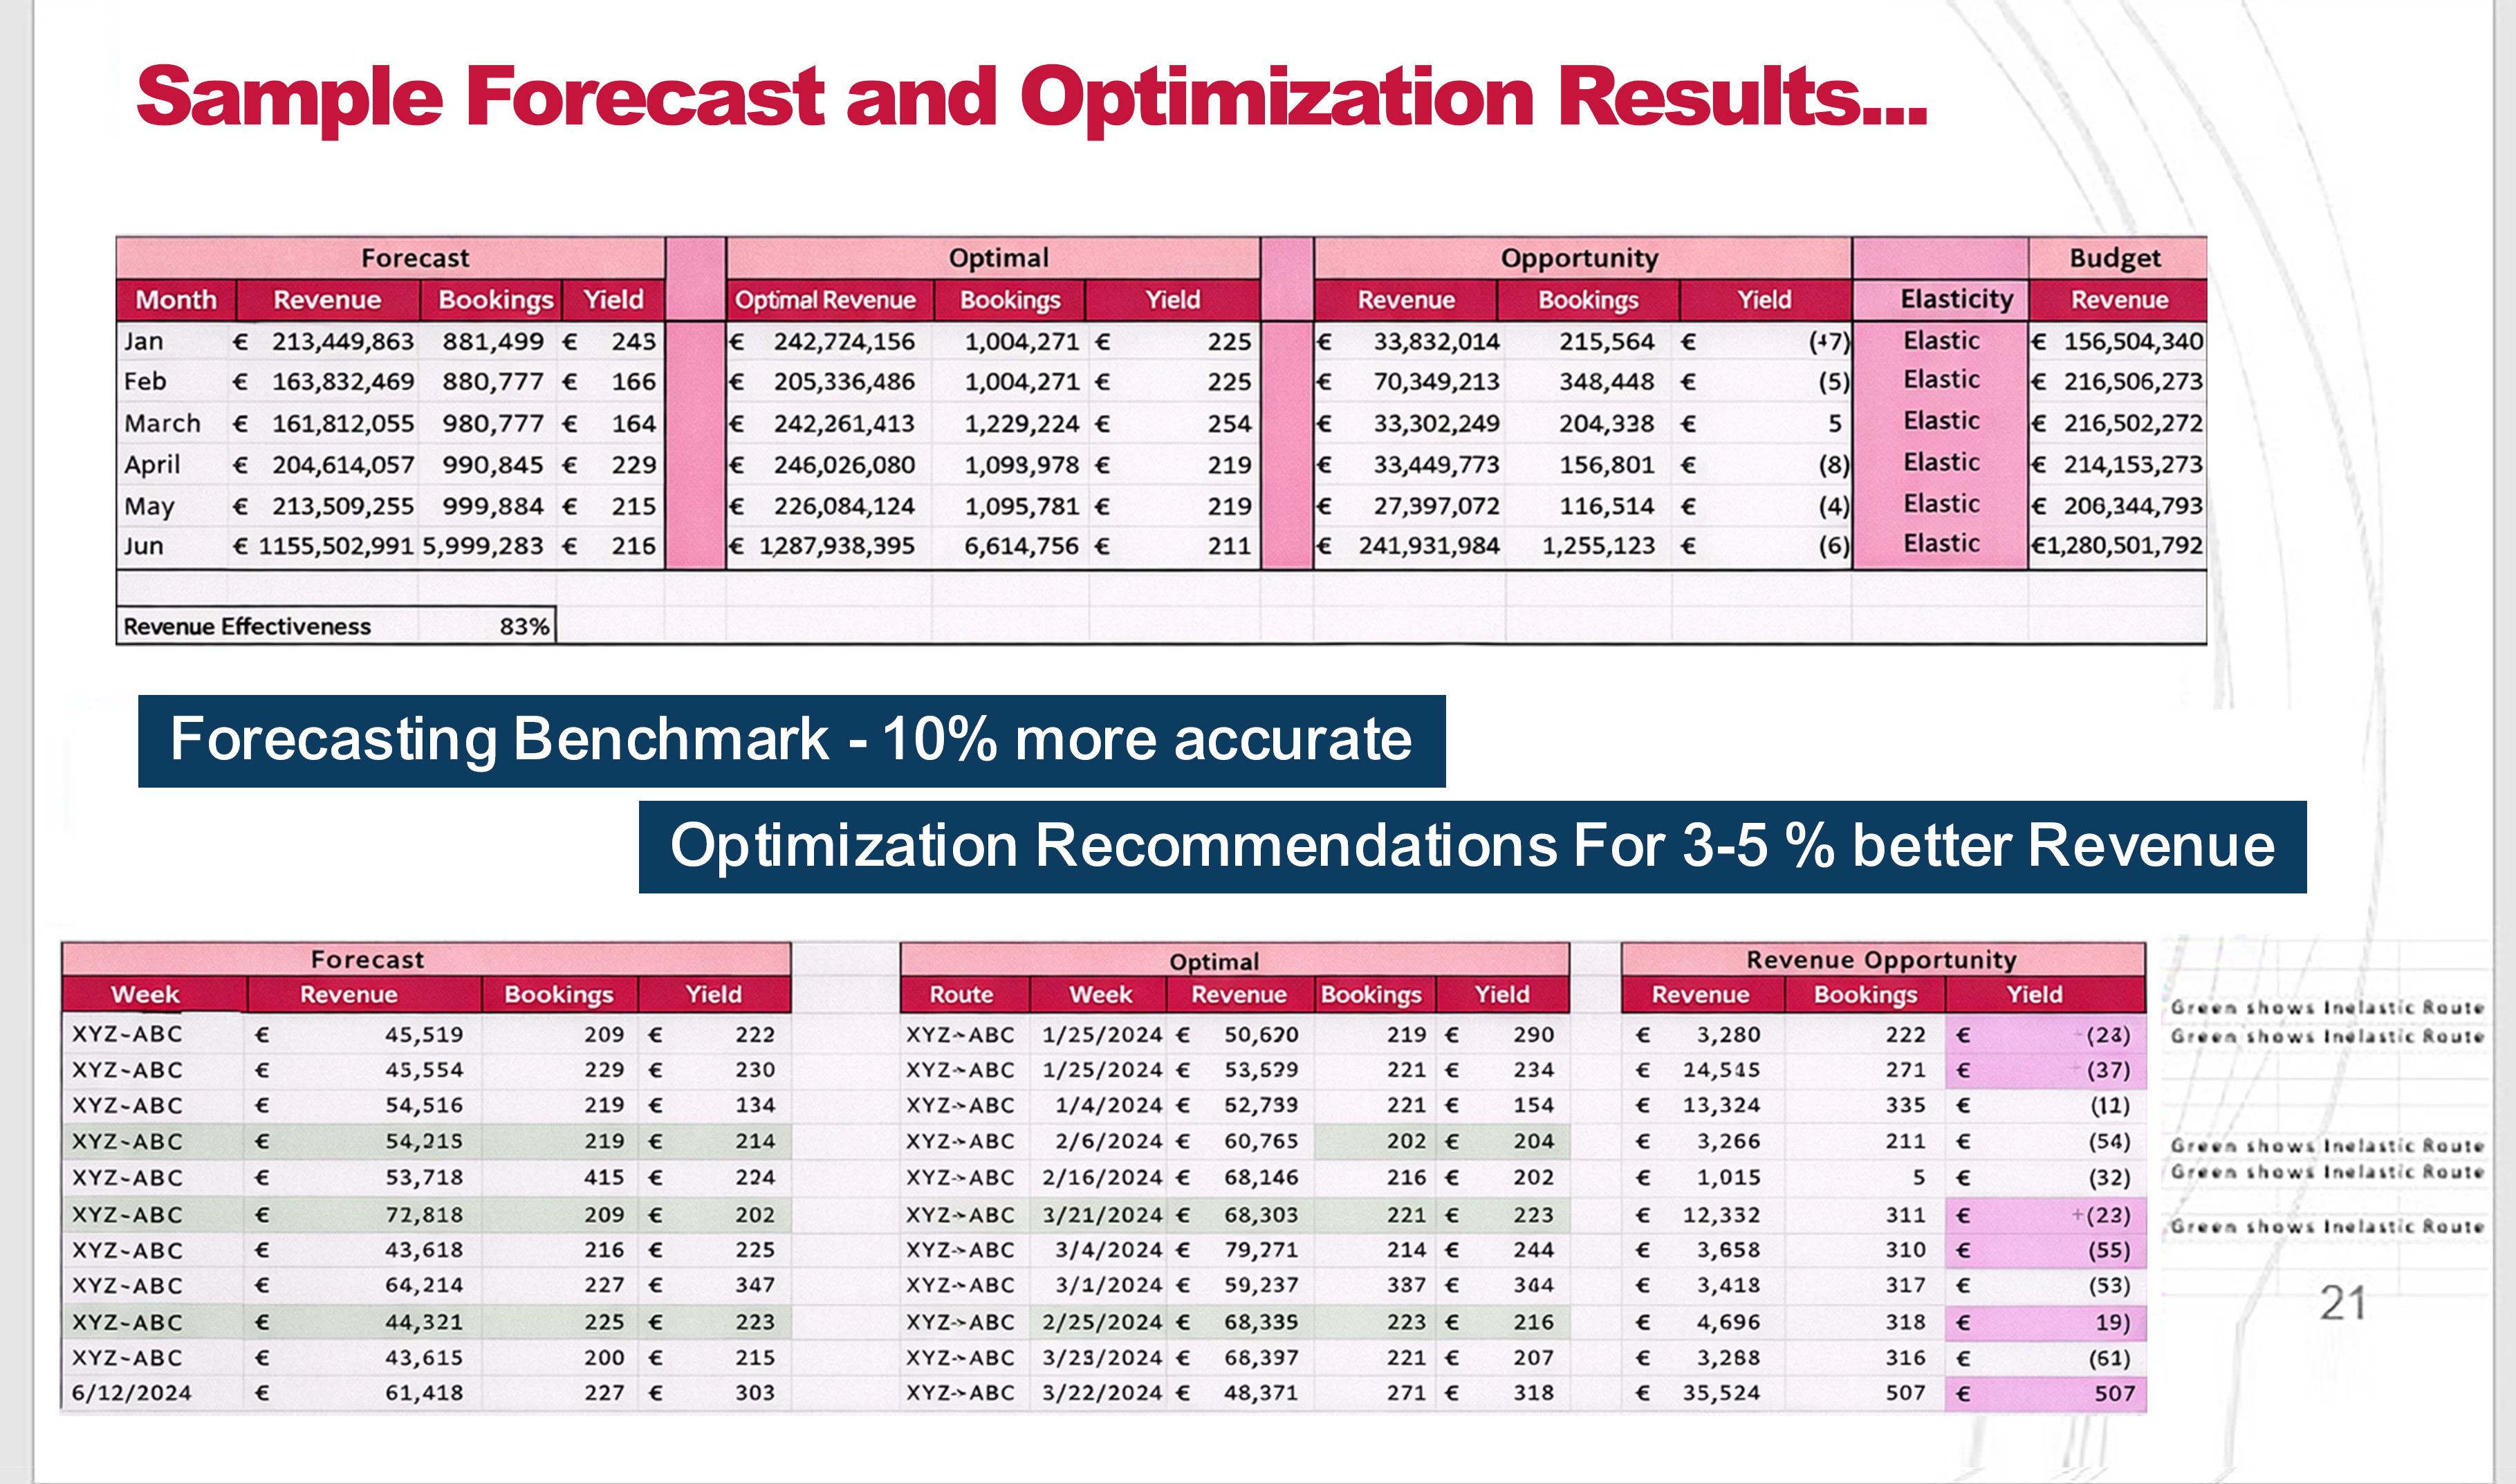
Has potential to drive up Incremental Revenue 3-5%

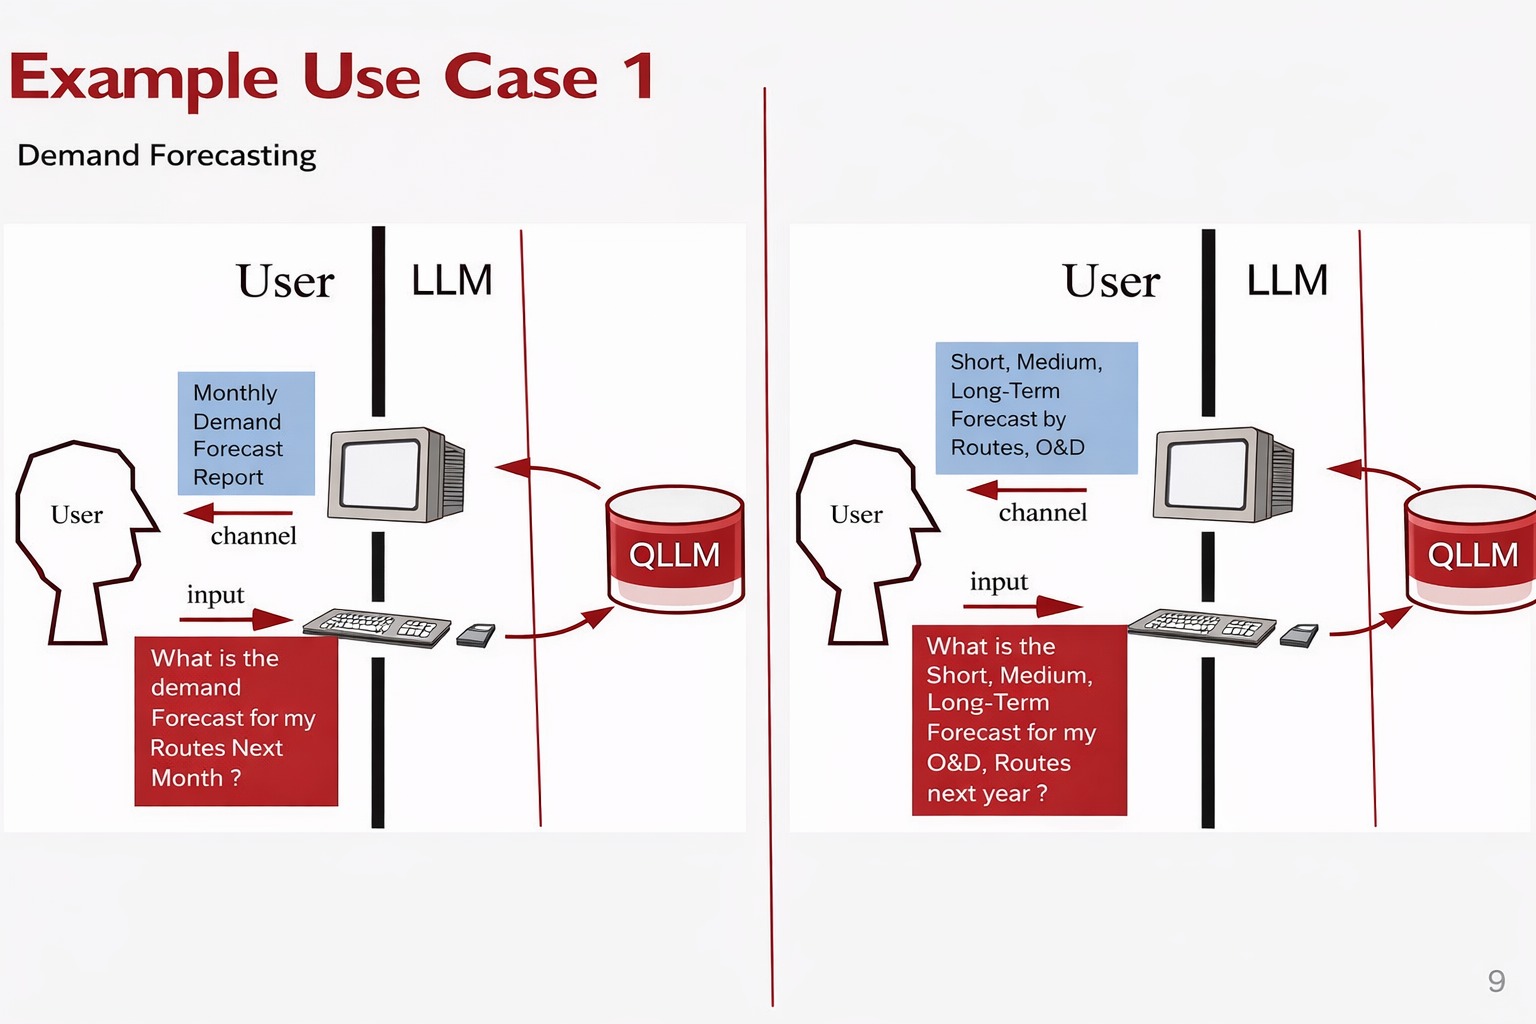
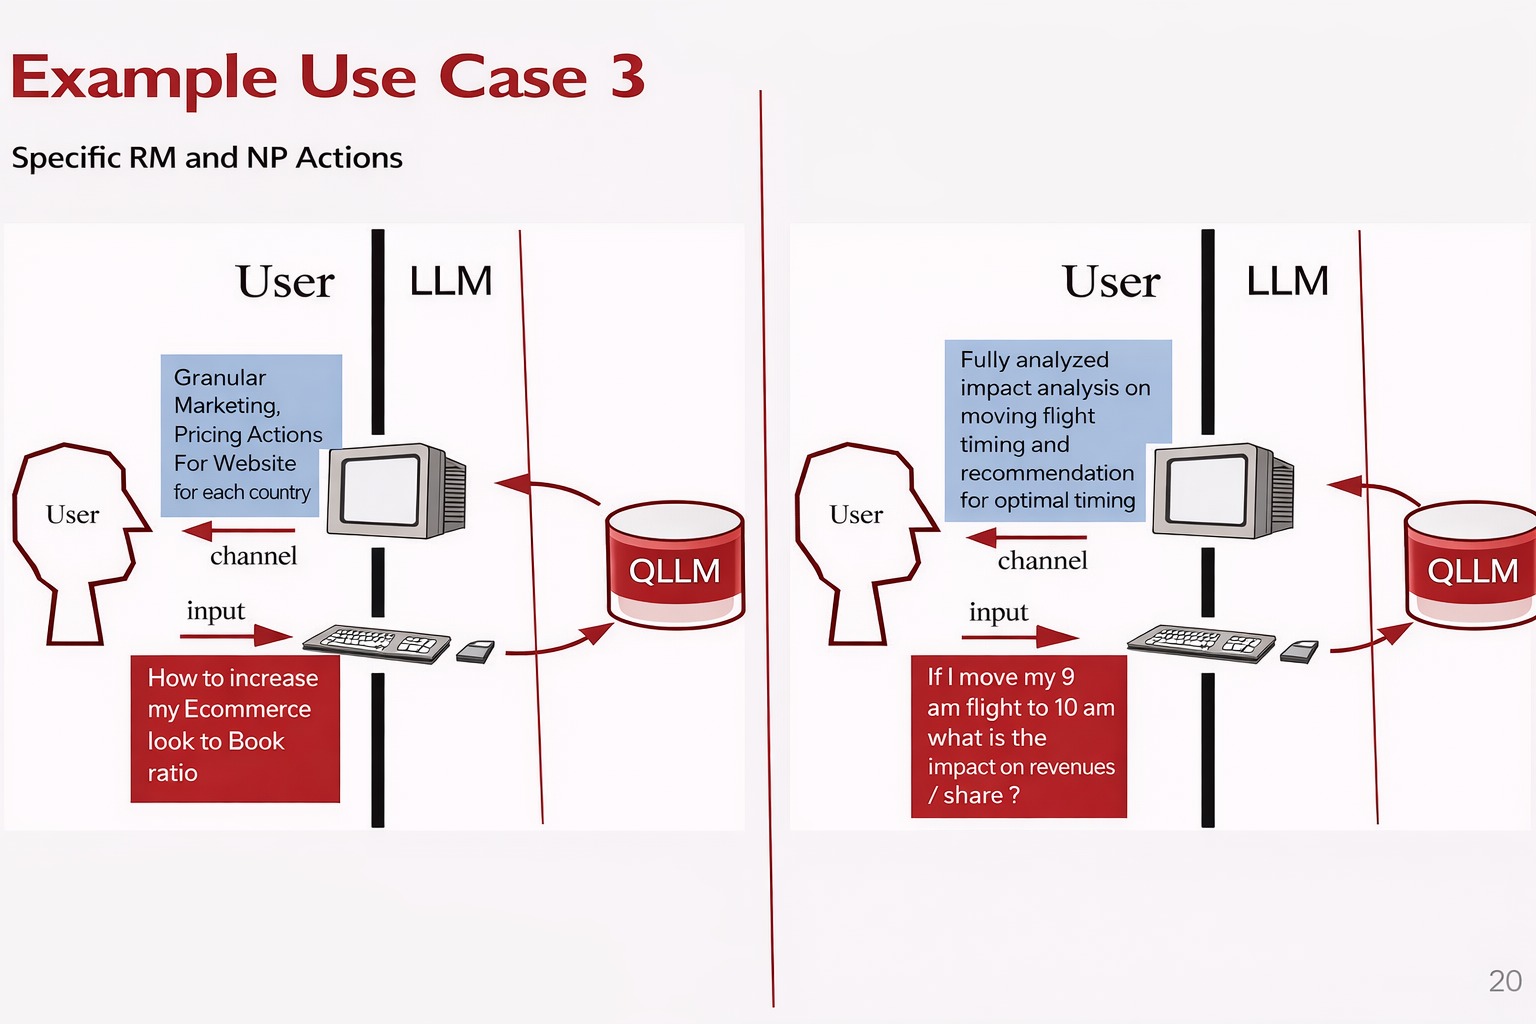
This is mainly due to better demand forecasting and local optimization

Very simple hardware needs. Very small storage needed. Very few GPUs needed (10–20 max)

ROI can be very big as you would not need to spend on multiple AI projects all over

Yet the Revenue impact can be very high

Year 1
Year 2
Year 3
Year 4
Year 5
5 Years Normal AI Path
6 Months
6 Months to Full Optimization with QLLM Path
23

License Model

License the Product

Full QLLM Software Product License

Product is configured by Quad Optima
Product on Prem or Private Cloud
No ETL or significant work done by Indigo team
Work with IT to get access to data
Configuration , Training of Models 2-3 months
Model outputs available for Testing in 3-4 Months from Start

Pricing : Upfront plus annual

License the Design

Full Algorithm Design License

Fully Functional Design provided by Quad Advisory
License agreement for Indigo to USE the DESIGN
Indigo can develop platform to support internal use
Quad Advisory team will help Indigo Development team
Configuration and Training may take upto 6 months due to internal development
Model outputs available for Testing from 6 months from Start

Pricing : One time

For 3 Billion Airline expected annual incremental revenues – 100-150 million USD

About Us

Our vision is delivered through an elegant Digital Twin AI architecture featuring a single enterprise catalog, single deep learning AI platform anchored by a single data fabric of your entire organization.

Contact Us

© 2026 Created with Quadoptima
Scroll to Top